The main page of the financial report is located in the Analytics section and is used for financial analysis across all projects.
It allows you to:
- evaluate income and expenses
- track payment deviations
- analyze profit
- review detailed data by project
Filters
At the top of the page, there is a filter panel. Selected filters are preserved when navigating within the report.
Available filters:
- My companies
Used to filter data by your legal entities.
Important: there is no single “project company” in the system — the company is assigned at the estimate sheet level.
This means:- one project can include multiple sheets with different companies
- the filter works strictly by estimate sheets
- the report will display only income and expenses related to sheets with the selected company
- Statuses
Filter by project statuses - Venues
Filter by project venues - Manager
Filter by the first project role (by default — “Manager”).
The name of this role may differ if it has been renamed in the system settings - Counterparties
Counterparties are assigned when generating a document package in the project.
Key behavior:- if no document package has been created, the project will not appear in this filter
- a project can have multiple counterparties
- they are displayed as a comma-separated list
- the project is included if it matches at least one selected counterparty
- Customers
Filter by project customers - Period
Time range for analysis - Include tax
Toggle:- enabled — values include tax
- disabled — tax is excluded from income and expenses
- Accounting by project date / by expense date
Defines how expenses are considered:- by project date — expenses are linked to the project
- by expense date — expenses are considered based on their actual date
- Reset filters
Resets all filters to default values
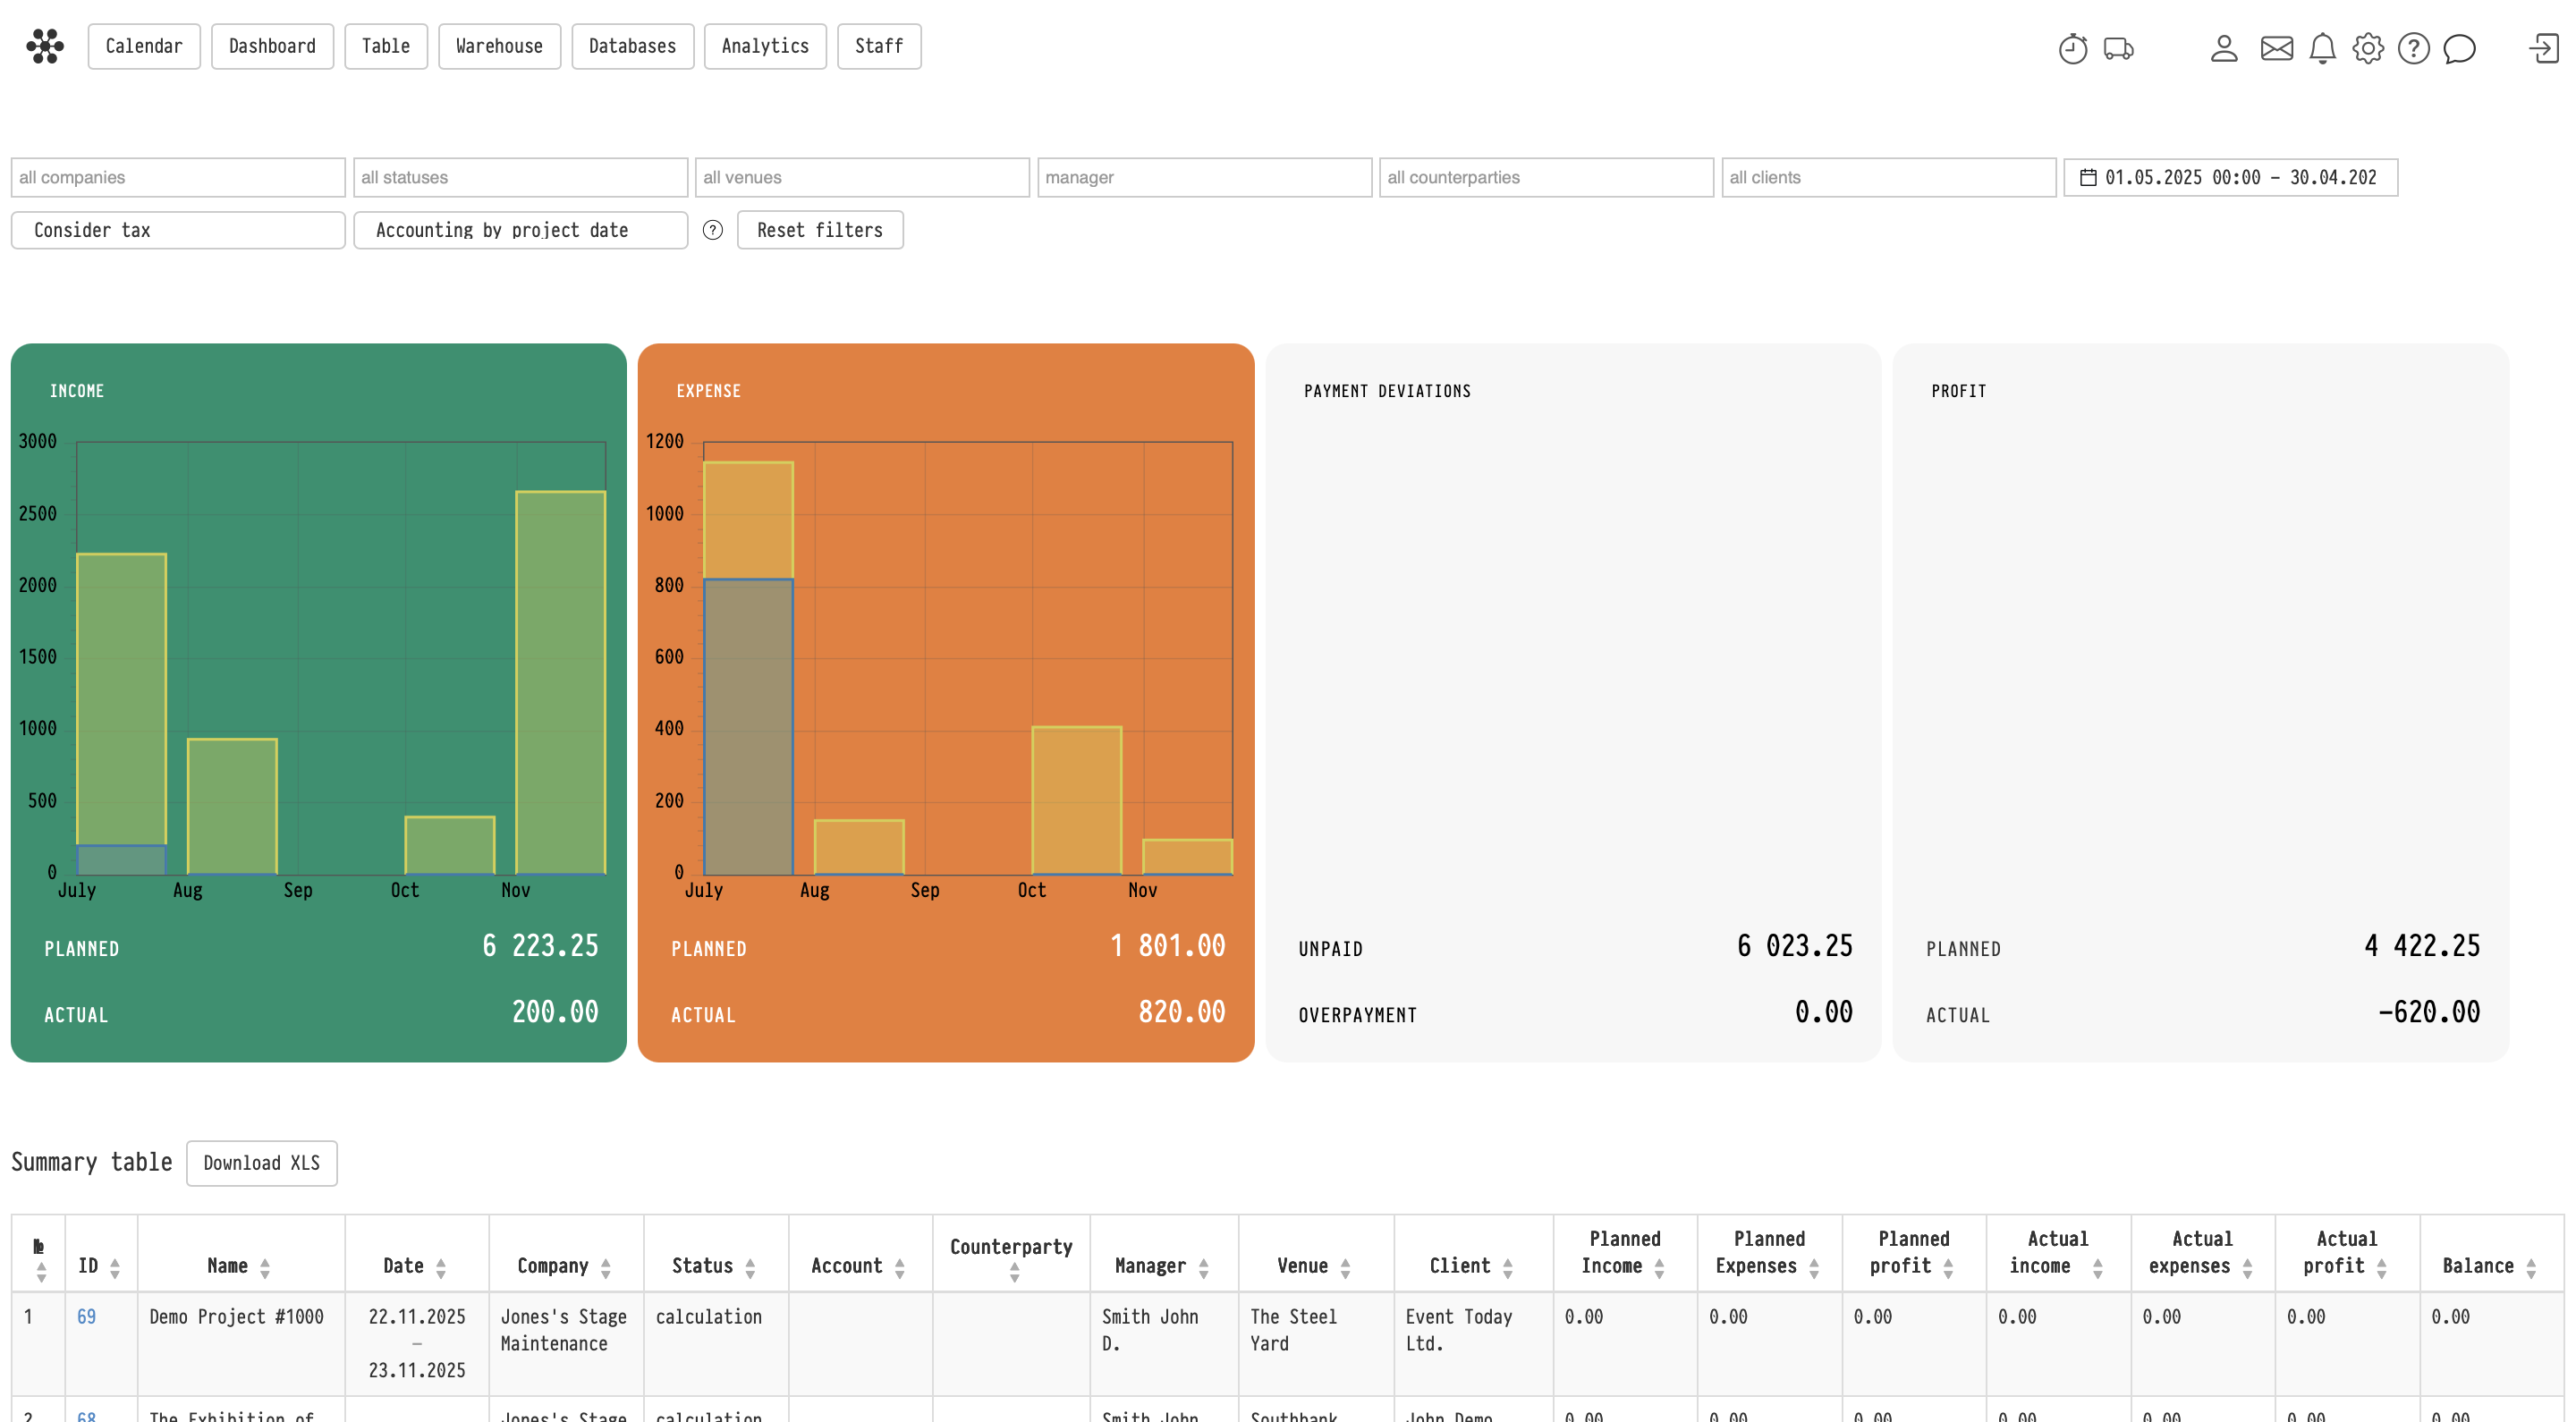
Charts
In the central part of the page, charts display:
- Income (green)
- Expense (orange)
Each includes:
- Planned — based on the estimate
- Actual — based on real financial data (Project → Finance tab → Income/Expense)
Charts are built by months within the selected period.
Additional blocks
On the right side:
Payment deviations
- Unpaid — outstanding customer payments
- Overpayment — excess payments
Profit
- Planned — calculated from the estimate
- Actual — calculated from actual financial data
Project table
At the bottom, a table displays projects matching the selected filters.
The table includes:
- project number and name
- date
- company
- status
- bill
- counterparty
- manager
- venue
- customer
- financial indicators:
- planned income, expense, profit
- actual income, expense, profit
- balance
Key behaviors:
- clicking the project number opens the project in a new browser tab
- all values respect the applied filters
Export
The Download XLS button exports the project table to Excel.
Only the table data is exported (charts and summary blocks are not included).
Key concepts
Finance, Analytics, Income, Expense, Profit, Project, Manager, My companies, Counterparty, Customer, Estimate, Filters, Report