The Income section is one of the subsections of the Financial report and is designed to analyze the planned and actual income of the company based on project data.
Go to:
Analytics → Financial report → Income
The report allows you to separately analyze income from equipment rental, services, and consumables, as well as view detailed information by projects and specific catalog entries.
All filters located at the top of the page work the same way as on the main Financial report page and apply to all Income subsections.
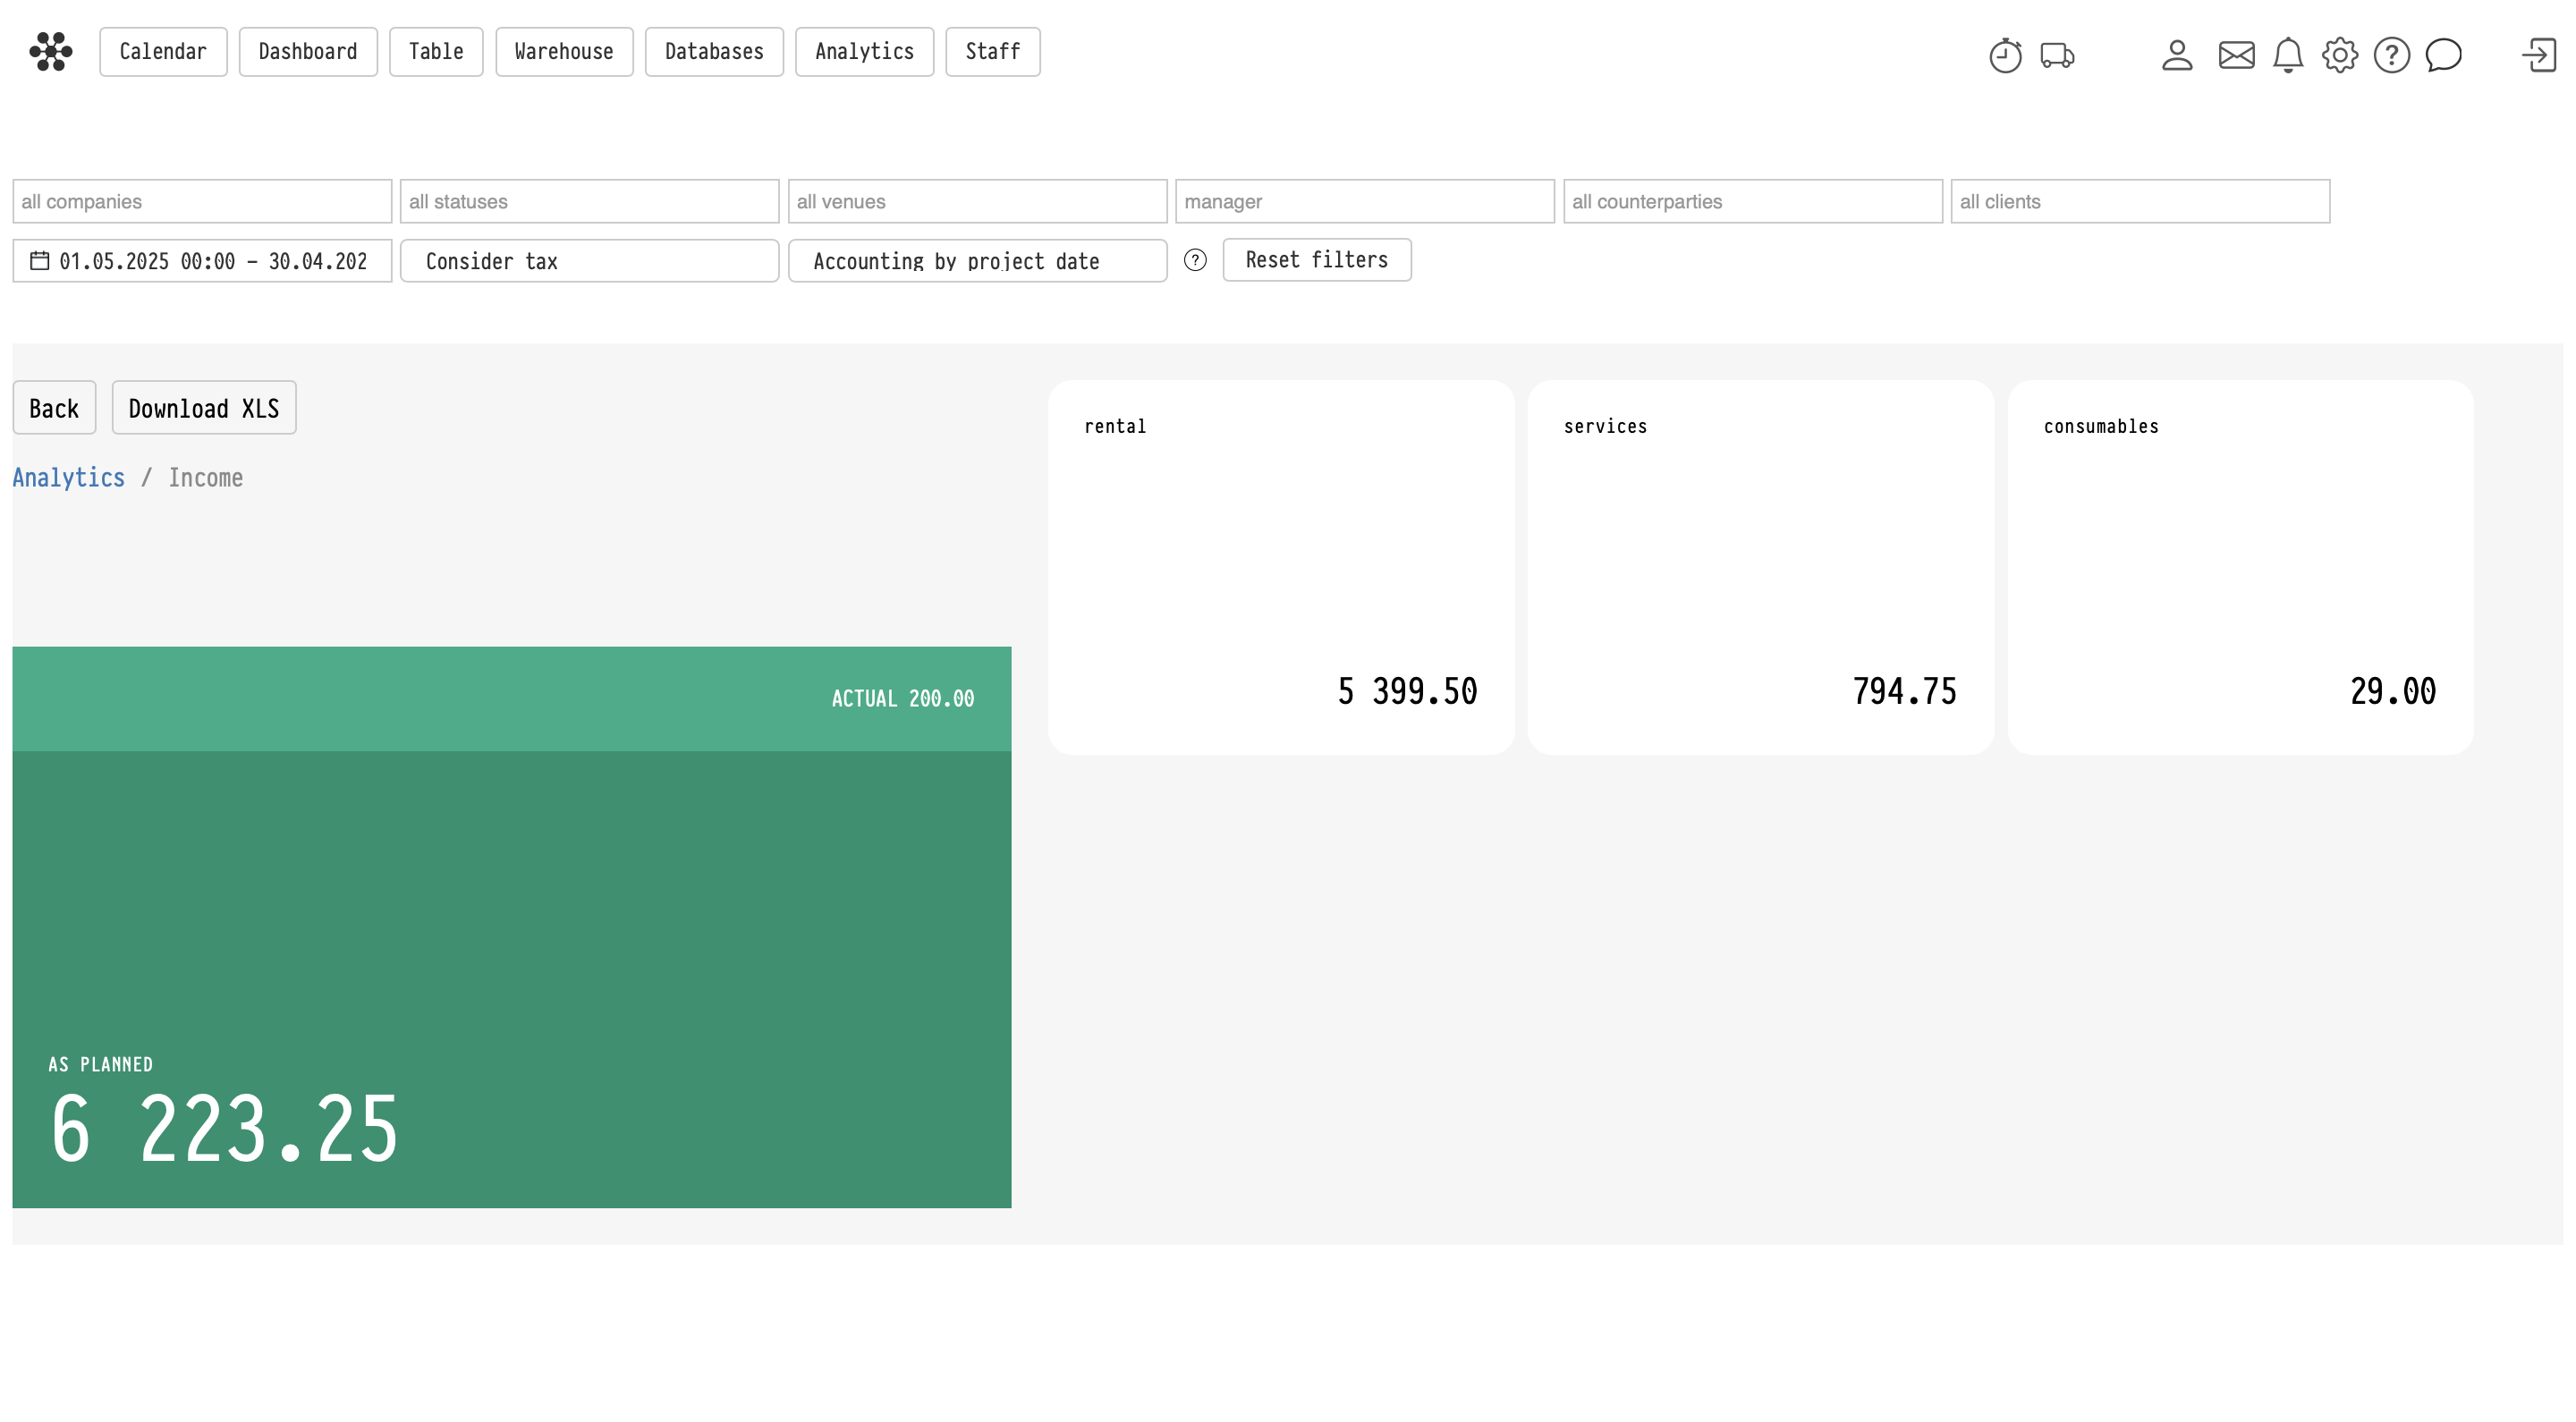
Main Income page
The main page displays:
– planned income — amounts from project Estimates,
– actual income — amounts from the Finance tab inside projects,
– separate blocks for:
– rental,
– services,
– consumables.
Each block opens the corresponding analytics subsection.
Structure of Income subsections
Each subsection (Income from rental, Income from services, Consumables) contains two tabs:
– Projects,
– a tab with the corresponding entry type:
– Equipment,
– Services,
– Consumables.
Projects tab
The Projects tab displays a list of projects where the corresponding entries were used.
For each project, the report displays:
– project number or title,
– project date,
– income amount.
The “+” button in the Detailed column allows you to expand the project structure and view the specific entries included in the income calculation.
For example:
– equipment used in the project,
– services included in the project,
– consumables written off within the project.
Income is calculated taking into account:
– per-entry discounts,
– coefficients,
– global section discount,
– global section coefficient.
Entry tab
The second tab displays aggregated analytics by specific catalog entries.
For example:
– which equipment entries generated the highest income,
– which services were used most frequently,
– which consumables were most actively used in projects.
For each entry, the report displays:
– entry name,
– quantity,
– average price,
– total income amount.
The “+” button in the Detailed column allows you to expand the list of projects where the selected entry was used.
Quantity and fractional values
The system supports fractional quantity values for services and consumables.
For example:
– 0.5,
– 1.25,
– 174.5.
These values are correctly displayed in analytics and included in income calculations.
Export to Excel
The Download XLS button exports the current table to Excel.
For example:
– if the Income from rental → Equipment section is open, the equipment table will be exported,
– if the Consumables → Projects section is open, the consumables project list will be exported.
Report specifics
– The report includes only income generated from project Estimates.
– Manual financial operations are not included in this report.
– All subsections use the common Financial report filters.
– The detail view allows you to quickly move from aggregated analytics to specific projects and catalog entries.
Key concepts
income, financial report, analytics, income from rental, income from services, consumables, equipment, projects, detailed view, average price, planned income, actual income, XLS, Excel export, filters, coefficients, discounts, project analytics, equipment analytics, service analytics, consumables analytics